signal strength 2 of 5

The Triple Top pattern has formed on the chart of the GOLD M15 trading instrument. It is a reversal pattern featuring the following characteristics: resistance level 76, support level -995, and pattern’s width 1554. Forecast If the price breaks through the support level 3111.14, it is likely to move further down to 3124.98.
The M5 and M15 time frames may have more false entry points.
See Also
- All
- Double Top
- Flag
- Head and Shoulders
- Pennant
- Rectangle
- Triangle
- Triple top
- All
- #AAPL
- #AMZN
- #Bitcoin
- #EBAY
- #FB
- #GOOG
- #INTC
- #KO
- #MA
- #MCD
- #MSFT
- #NTDOY
- #PEP
- #TSLA
- #TWTR
- AUDCAD
- AUDCHF
- AUDJPY
- AUDUSD
- EURCAD
- EURCHF
- EURGBP
- EURJPY
- EURNZD
- EURRUB
- EURUSD
- GBPAUD
- GBPCHF
- GBPJPY
- GBPUSD
- GOLD
- NZDCAD
- NZDCHF
- NZDJPY
- NZDUSD
- SILVER
- USDCAD
- USDCHF
- USDJPY
- USDRUB
- All
- M5
- M15
- M30
- H1
- D1
- All
- Buy
- Sale
- All
- 1
- 2
- 3
- 4
- 5
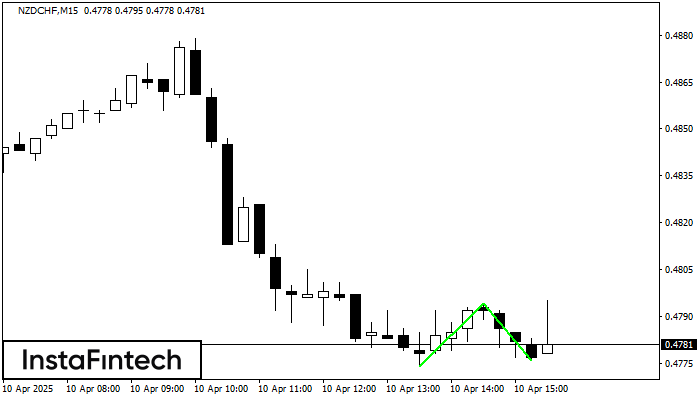
The Double Bottom pattern has been formed on NZDCHF M15. Characteristics: the support level 0.4774; the resistance level 0.4794; the width of the pattern 20 points. If the resistance level
The M5 and M15 time frames may have more false entry points.
Open chart in a new window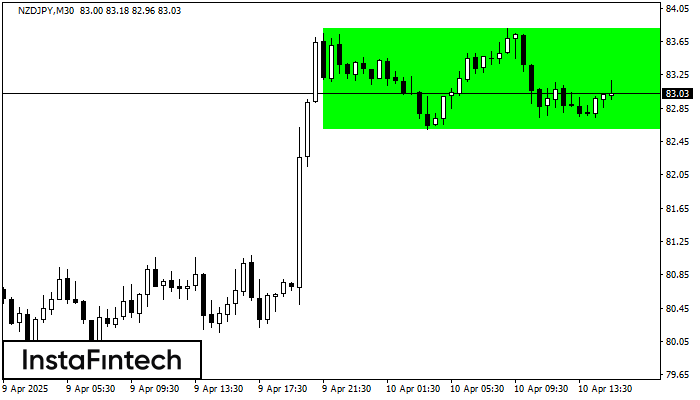
According to the chart of M30, NZDJPY formed the Bullish Rectangle. This type of a pattern indicates a trend continuation. It consists of two levels: resistance 83.80 and support 82.60
Open chart in a new window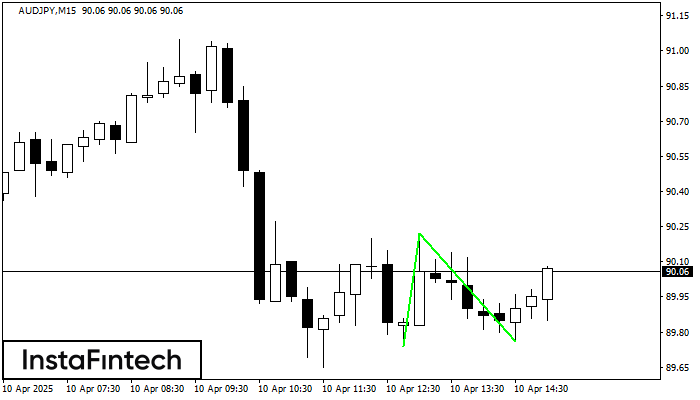
The Double Bottom pattern has been formed on AUDJPY M15. Characteristics: the support level 89.74; the resistance level 90.22; the width of the pattern 48 points. If the resistance level
The M5 and M15 time frames may have more false entry points.
Open chart in a new window