signal strength 2 of 5
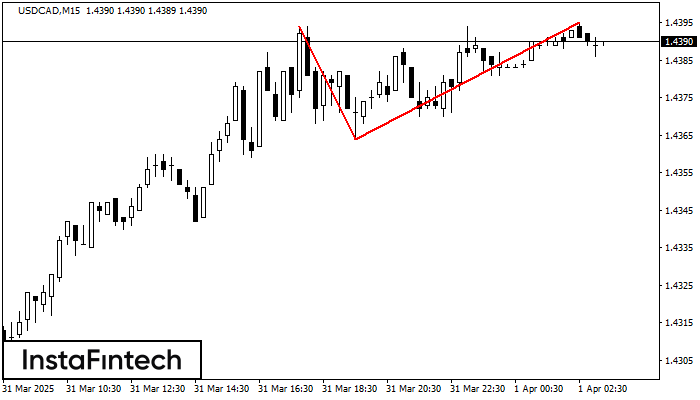
The Double Top reversal pattern has been formed on USDCAD M15. Characteristics: the upper boundary 1.4394; the lower boundary 1.4364; the width of the pattern is 31 points. Sell trades are better to be opened below the lower boundary 1.4364 with a possible movements towards the 1.4341 level.
The M5 and M15 time frames may have more false entry points.
See Also
- All
- Double Top
- Flag
- Head and Shoulders
- Pennant
- Rectangle
- Triangle
- Triple top
- All
- #AAPL
- #AMZN
- #Bitcoin
- #EBAY
- #FB
- #GOOG
- #INTC
- #KO
- #MA
- #MCD
- #MSFT
- #NTDOY
- #PEP
- #TSLA
- #TWTR
- AUDCAD
- AUDCHF
- AUDJPY
- AUDUSD
- EURCAD
- EURCHF
- EURGBP
- EURJPY
- EURNZD
- EURRUB
- EURUSD
- GBPAUD
- GBPCHF
- GBPJPY
- GBPUSD
- GOLD
- NZDCAD
- NZDCHF
- NZDJPY
- NZDUSD
- SILVER
- USDCAD
- USDCHF
- USDJPY
- USDRUB
- All
- M5
- M15
- M30
- H1
- D1
- All
- Buy
- Sale
- All
- 1
- 2
- 3
- 4
- 5
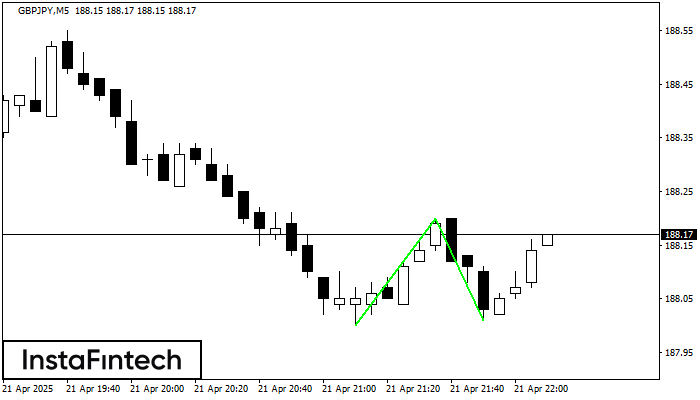
The Double Bottom pattern has been formed on GBPJPY M5. Characteristics: the support level 188.00; the resistance level 188.20; the width of the pattern 20 points. If the resistance level
The M5 and M15 time frames may have more false entry points.
Open chart in a new window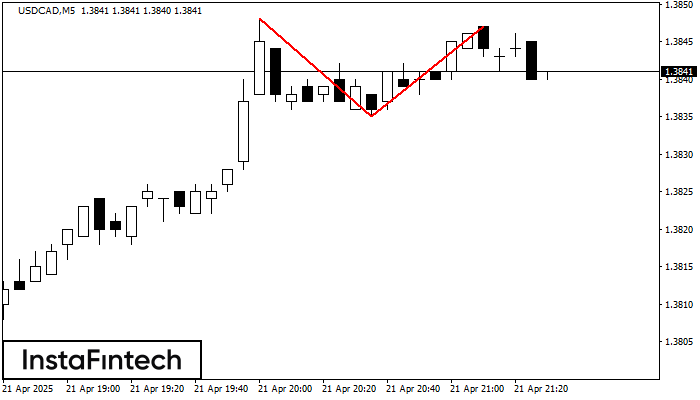
The Double Top pattern has been formed on USDCAD M5. It signals that the trend has been changed from upwards to downwards. Probably, if the base of the pattern 1.3835
The M5 and M15 time frames may have more false entry points.
Open chart in a new window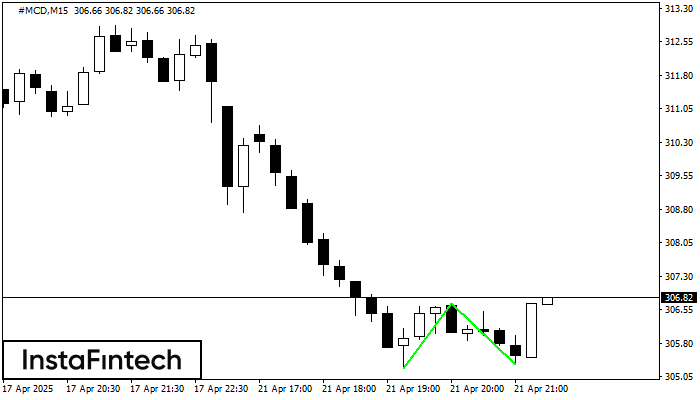
The Double Bottom pattern has been formed on #MCD M15. Characteristics: the support level 305.24; the resistance level 306.70; the width of the pattern 146 points. If the resistance level
The M5 and M15 time frames may have more false entry points.
Open chart in a new window