signal strength 2 of 5

The Triple Top pattern has formed on the chart of the GOLD M15. Features of the pattern: borders have an ascending angle; the lower line of the pattern has the coordinates 3111.43/3112.94 with the upper limit 3127.49/3126.34; the projection of the width is 1606 points. The formation of the Triple Top figure most likely indicates a change in the trend from upward to downward. This means that in the event of a breakdown of the support level of 3111.43, the price is most likely to continue the downward movement.
The M5 and M15 time frames may have more false entry points.
Juga lihat
- All
- Double Top
- Flag
- Head and Shoulders
- Pennant
- Rectangle
- Triangle
- Triple top
- All
- #AAPL
- #AMZN
- #Bitcoin
- #EBAY
- #FB
- #GOOG
- #INTC
- #KO
- #MA
- #MCD
- #MSFT
- #NTDOY
- #PEP
- #TSLA
- #TWTR
- AUDCAD
- AUDCHF
- AUDJPY
- AUDUSD
- EURCAD
- EURCHF
- EURGBP
- EURJPY
- EURNZD
- EURRUB
- EURUSD
- GBPAUD
- GBPCHF
- GBPJPY
- GBPUSD
- GOLD
- NZDCAD
- NZDCHF
- NZDJPY
- NZDUSD
- SILVER
- USDCAD
- USDCHF
- USDJPY
- USDRUB
- All
- M5
- M15
- M30
- H1
- D1
- All
- Buy
- Sale
- All
- 1
- 2
- 3
- 4
- 5
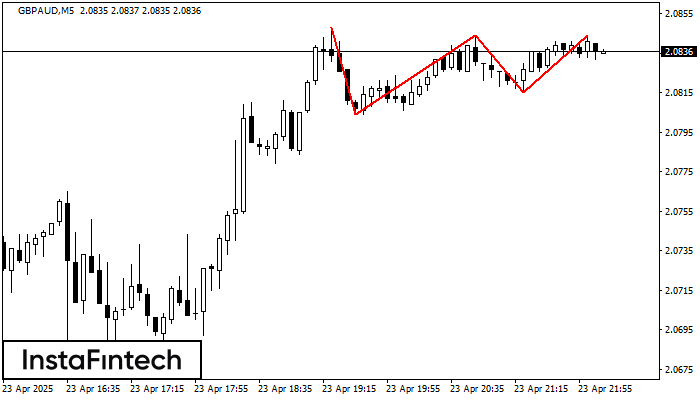
Corak Triple Top telah dibentuk pada carta GBPAUD M5. Ciri corak: sempadan mempunyai sudut menaik; garisan bawah corak mempunyai koordinat 2.0804/2.0815 dengan had atas 2.0848/2.0844; unjuran lebar ialah 44 mata
Carta masa M5 dan M15 mungkin mempunyai lebih banyak titik kemasukan palsu.
Open chart in a new window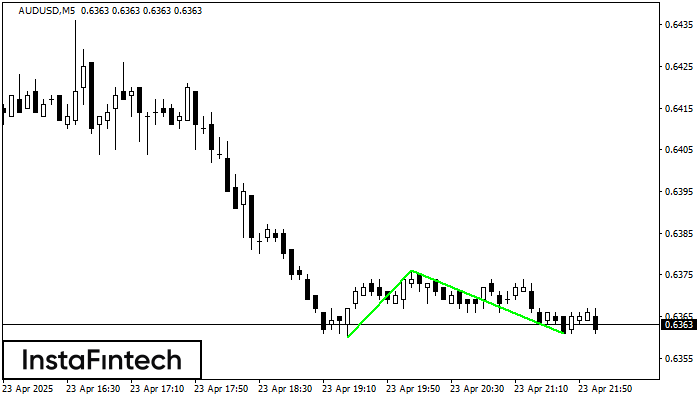
Corak Double Bottom telah dibentuk pada AUDUSD M5; sempadan atas adalah 0.6376; sempadan bawah adalah 0.6361. Lebar corak adalah 16 mata. Sekiranya penembusan sempadan atas 0.6376, perubahan aliran boleh diramalkan
Carta masa M5 dan M15 mungkin mempunyai lebih banyak titik kemasukan palsu.
Open chart in a new window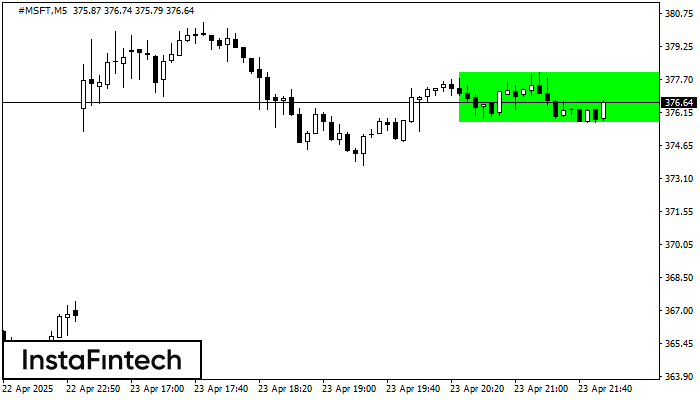
Berdasarkan carta M5, #MSFT telah membentuk Segi Empat Menaik yang merupakan corak kesinambungan aliran. Corak adalah terkandung dalam sempadan berikut: sempadan bawah 375.68 – 375.68 dan sempadan atas 378.01 –
Carta masa M5 dan M15 mungkin mempunyai lebih banyak titik kemasukan palsu.
Open chart in a new window