empty
10.04.2023 06:41 AM
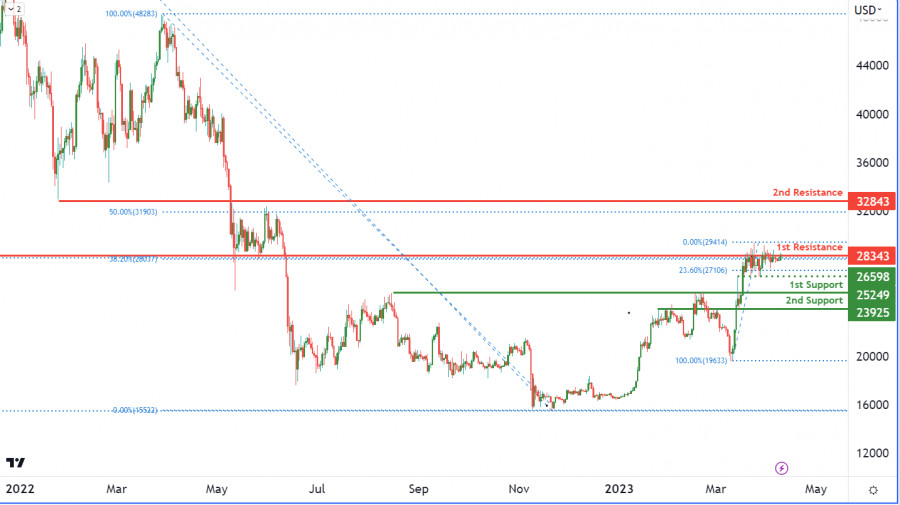
BTCUSD, Daily | Potential reversal from 1st resistance?

This image is no longer relevant

The BTC/USD chart currently reflects a bearish momentum in the cryptocurrency market, and Bitcoin seems to be following the trend. The chart suggests that the price of Bitcoin could face resistance at the 1st resistance level of 28343, which has previously been an important level as an overlap resistance. If Bitcoin fails to break through this level, it may result in a bearish reaction causing the price to drop towards the 1st support level of 25249. This level, being a pullback support, could act as a strong support for the price of Bitcoin.

In the event that the price of Bitcoin breaks through the 1st resistance level, the next resistance level it could face is the 2nd resistance level of 32843, which is a pullback resistance. Conversely, if Bitcoin breaks below the 1st support level, the next support level it could drop to is the 2nd support level of 23925. This level, also being a pullback support, could potentially act as a strong support for the price of Bitcoin.

Additionally, there is an intermediate support level at 26598, which is a swing low support and is accompanied by a 23.60% Fibonacci retracement. This level could potentially provide support to the price of Bitcoin if it drops towards the 1st support level. Overall, the BTC/USD chart's momentum is bearish, indicating that the price is expected to continue falling in the near term.

ٹائم فریم منتخب کریں
5
منٹ
15
منٹ
30
منٹ
1
گھنٹہ
4
گھنٹے
1
دن
1
ہفتہ
انسٹافاریکس کے ساتھ کرپٹو کرنسی کی معاملاتی تبدیلیوں سے کمائیں۔
میٹا ٹریڈر 4 ڈاؤن لوڈ کریں اور اپنی پہلی ٹریڈ کھولیں۔
  • Grand Choice
    Contest by
    InstaForex
    InstaForex always strives to help you
    fulfill your biggest dreams.
    مقابلہ میں شامل ہوں

تجویز کردہ مضامین

یورو / یو ایس ڈی کی پیشن گوئی برائے 07 اپریل 2025

جمعہ کو، اس بات کی وضاحت کرنا مشکل ہے کہ یورو / یو ایس ڈی پئیر نے بالکل کیا حاصل کیا۔ کمی ناقابل تردید ہے، جو امریکی ڈالر کی مضبوطی

Samir Klishi 19:20 2025-04-07 UTC+2

جی بی پی / یو ایس ڈی7 اپریل 2025 کی پیشن گوئی

گھنٹہ وار چارٹ پر، جی بی پی / یو ایس ڈی پئیر جمعہ کو امریکی ڈالر کے حق میں پلٹ گئی اور 1.3151 کی سطح سے گر کر 1.2865

Samir Klishi 19:11 2025-04-07 UTC+2

اپریل 7-9 2025 کے لیے سونے (ایکس اے یو / یو ایس ڈی) کے لیے تجارتی سگنل: $2,985 سے اوپر خریدیں (200 ای ایم اے - 6/8 مرے)

ایگل انڈیکیٹر اوور سولڈ لیول تک پہنچ رہا ہے، اس لیے ہم اگلے چند دنوں کے لیے 2,968 یا 2,985 سے اوپر دھات خریدنے کے مواقع تلاش کر سکتے ہیں۔

Dimitrios Zappas 18:52 2025-04-07 UTC+2

اپریل 7-9 2025 کے لیے یورو / یو ایس ڈی کے لیے تجارتی سگنل: 1.0986 سے نیچے فروخت (21 ایس ایم اے - 6/8 مرے)

اگر یورو 1.0986 سے اوپر مستحکم ہو جاتا ہے، تو ہم اوپر کی حرکت کے تسلسل کی توقع کر سکتے ہیں، اور یورو / یو ایس ڈی 1.1108 پر 7/8

Dimitrios Zappas 18:51 2025-04-07 UTC+2

اپریل- 4-7 2025 کے لیے سونے (ایکس اے یو / یو ایس ڈی) کے لیے تجارتی سگنل: $3,120 سے نیچے فروخت کریں یا $3,025 سے اوپر خریدیں (21 ایس ایم اے - ریباؤنڈ)

دوسری طرف، 3,120 سے اوپر کا استحکام تیزی کے چکر کے دوبارہ شروع ہونے کا اشارہ دے سکتا ہے، اور سونا 3,167 کی بلند ترین سطح تک پہنچ سکتا

Dimitrios Zappas 20:32 2025-04-04 UTC+2

یورو / یو ایس ڈی اور جی بی پی / یو ایس ڈی 4 اپریل – تکنیکی تجزیہ

کئی کوششوں اور تین ہفتوں کے استحکام کے بعد، بیلوں نے آخرکار ایک بریک آؤٹ شروع کیا، جس سے وہ کل ماہانہ (1.0943) اور ہفتہ وار (1.0978) ٹائم فریم

Evangelos Poulakis 17:02 2025-04-04 UTC+2

اپریل 3-5 2025 کے لیے سونے (ایکس اے یو / یو ایس ڈی) کے لیے تجارتی سگنل: $3,055 سے اوپر خریدیں (21 ایس ایم اے ایس ایم اے- واپسی)

اگر سونے کی قیمت اپ ٹرینڈ چینل کے اوپر واپس آتی ہے اور 3,075 سے اوپر مستحکم ہوتی ہے، تو آؤٹ لک تیزی کا شکار ہو سکتا ہے،

Dimitrios Zappas 18:20 2025-04-03 UTC+2

جی بی پی / یو ایس ڈی - 3 اپریل: ڈالر کے لیے ہفتہ کا بے معنی اختتام

گھنٹہ وار چارٹ پر، جی بی پی / یو ایس ڈی جوڑا ایک بار پھر اوپر کی طرف بڑھ گیا، کئی سطحوں اور مزاحمتی زونوں کو توڑ کر۔ اس وقت،

Samir Klishi 17:20 2025-04-03 UTC+2

جی بی ہی / یو ایس ڈی پیشن گوئی برائے 02 اپریل 2025

فی گھنٹہ چارٹ پر، جی بی پی / یو ایس ڈی پئیر منگل کو ایک طرف حرکت کرتا رہا۔ مارکیٹ میں فی الحال بُلز یا بئیرز کا کوئی غلبہ نہیں

Samir Klishi 16:55 2025-04-02 UTC+2

اپریل 2-5 2025 کے لیے یورو / یو ایس ڈی کے لیے تجارتی سگنل: 1.0815 سے نیچے فروخت کریں (21 ایس ایم اے - +1/8 مرے)

اگر یورو بیئرش ٹرینڈ چینل کے اوپر بریک کرتا ہے ہے اور مضبوط ہوتا ہے، تو ہم آنے والے دنوں میں اس کے +1/8 مرے کی سطح 1.0864 تک پہنچنے

Dimitrios Zappas 16:43 2025-04-02 UTC+2
ابھی فوری بات نہیں کرسکتے ؟
اپنا سوال پوچھیں بذریعہ چیٹ.
Widget callback
 

Dear visitor,

Your IP address shows that you are currently located in the USA. If you are a resident of the United States, you are prohibited from using the services of InstaFintech Group including online trading, online transfers, deposit/withdrawal of funds, etc.

If you think you are seeing this message by mistake and your location is not the US, kindly proceed to the website. Otherwise, you must leave the website in order to comply with government restrictions.

Why does your IP address show your location as the USA?

  • - you are using a VPN provided by a hosting company based in the United States;
  • - your IP does not have proper WHOIS records;
  • - an error occurred in the WHOIS geolocation database.

Please confirm whether you are a US resident or not by clicking the relevant button below. If you choose the wrong option, being a US resident, you will not be able to open an account with InstaForex anyway.

We are sorry for any inconvenience caused by this message.