signal strength 3 of 5

The Bearish pennant pattern has formed on the NZDUSD M30 chart. It signals potential continuation of the existing trend. Specifications: the pattern’s bottom has the coordinate of 0.5563; the projection of the flagpole height is equal to 29 pips. In case the price breaks out the pattern’s bottom of 0.5563, the downtrend is expected to continue for further level 0.5533.
- All
- Double Top
- Flag
- Head and Shoulders
- Pennant
- Rectangle
- Triangle
- Triple top
- All
- #AAPL
- #AMZN
- #Bitcoin
- #EBAY
- #FB
- #GOOG
- #INTC
- #KO
- #MA
- #MCD
- #MSFT
- #NTDOY
- #PEP
- #TSLA
- #TWTR
- AUDCAD
- AUDCHF
- AUDJPY
- AUDUSD
- EURCAD
- EURCHF
- EURGBP
- EURJPY
- EURNZD
- EURRUB
- EURUSD
- GBPAUD
- GBPCHF
- GBPJPY
- GBPUSD
- GOLD
- NZDCAD
- NZDCHF
- NZDJPY
- NZDUSD
- SILVER
- USDCAD
- USDCHF
- USDJPY
- USDRUB
- All
- M5
- M15
- M30
- H1
- D1
- All
- Buy
- Sale
- All
- 1
- 2
- 3
- 4
- 5
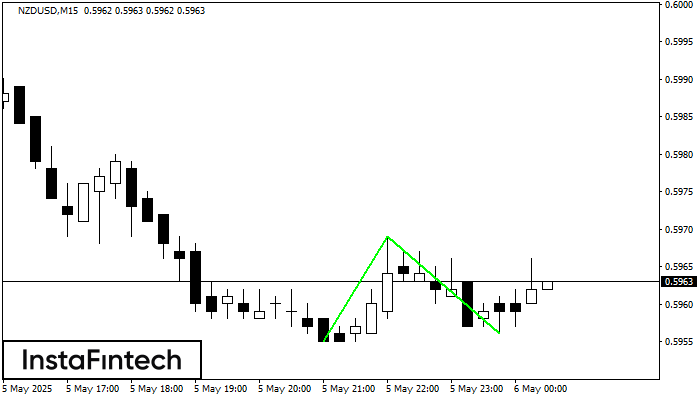
O padrão Fundo duplo foi formado em NZDUSD M15. Características: o nível de suporte 0.5955; o nível de resistência 0.5969; a largura do padrão 14 pontos. Se o nível
Os intervalos M5 e M15 podem ter mais pontos de entrada falsos.
Open chart in a new window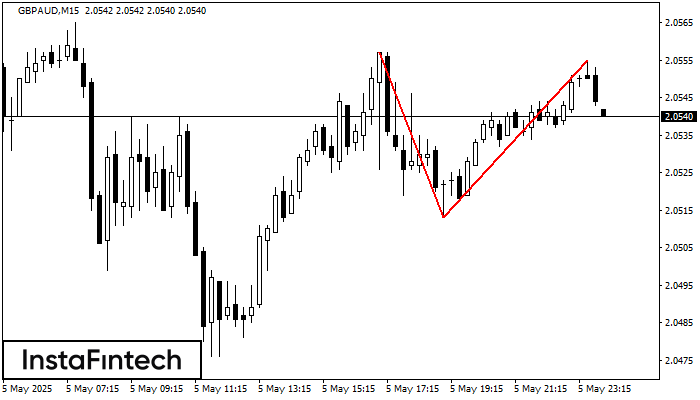
No gráfico de GBPAUD M15 o padrão de reversão Topo duplo foi formado. Características: o limite superior 2.0555; o limite inferior 2.0513; a largura do padrão 42 pontos. O sinal
Os intervalos M5 e M15 podem ter mais pontos de entrada falsos.
Open chart in a new window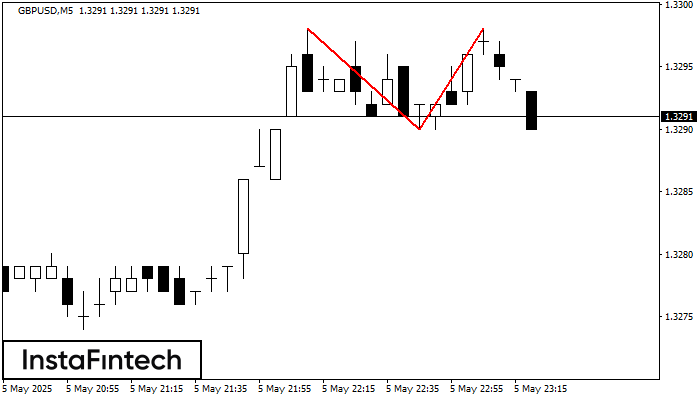
O padrão de reversão Topo duplo foi formado em GBPUSD M5. Características: o limite superior 1.3298; o limite inferior 1.3290; a largura do padrão é de 8 pontos. As operações
Os intervalos M5 e M15 podem ter mais pontos de entrada falsos.
Open chart in a new window