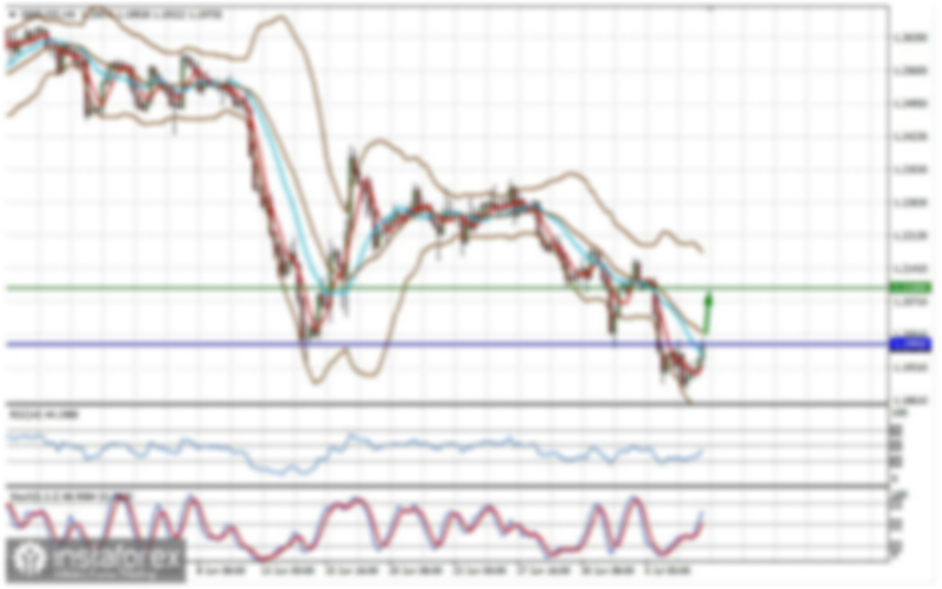
empty
08.07.2024 12:07 PM
Weekly forecast based on simplified wave analysis for GBP/USD, AUD/USD, USD/CHF, EUR/JPY, AUD/JPY, and US dollar index on July 8th

GBP/USD

Analysis:

The downward wave of the British pound chart from July of last year continues to correct the pair's main trend. Quotes are within a powerful potential reversal zone. Currently, the wave structure appears incomplete. Since last month, the pair's quotes have been drifting mostly sideways, forming the wave's middle part (B).

Forecast:

Throughout the upcoming week, the pair is expected to complete the current bullish movement of the British pound. Subsequently, a reversal will likely form near the resistance zone, initiating a downward movement. The support zone indicates the expected lower boundary of the pair's weekly movement.

This image is no longer relevant

Potential Reversal Zones

  • Resistance:
    • 1.2850/1.2900
  • Support:
    • 1.2630/1.2580

Recommendations:

  • Purchases: Have limited potential. It is advisable to reduce the trading lot.
  • Sales: It is safer to refrain from trading until confirmed reversal signals appear near the resistance zone.

AUD/USD

Analysis:

The currently incomplete upward wave of the Australian dollar chart has been forming since April 19. In its structure, the corrective part (B) has been forming as a shifting plane in the last four weeks. It lacks the final segment.

Forecast:

The pair is expected to complete the bullish movement in the coming days. Within the calculated resistance boundaries, a reversal can be expected, followed by the resumption of the bearish movement. The calculated support levels limit the downside potential.

This image is no longer relevant

Potential Reversal Zones

  • Resistance:
    • 0.6780/0.6830
  • Support:
    • 0.6630/0.6580

Recommendations:

  • Purchases: Carry a high degree of risk and may become unprofitable.
  • Sales: This will become possible after reversal signals appear. It is advisable to reduce the trading lot.

USD/CHF

Analysis:

The price rise of the major Swiss franc pair resulted in contact with the lower boundary of a powerful resistance zone. Since early May, quotes have declined, forming the first part of a corrective wave. Recently, a horizontal pullback has formed within it, nearing completion.

Forecast:

The flat movement is expected to be fully completed at the beginning of the upcoming week. Near the resistance zone, a reversal is expected, with the resumption of the bearish movement. The highest activity is likely at the end of the week.

This image is no longer relevant

Potential Reversal Zones

  • Resistance:
    • 0.9030/0.9080
  • Support:
    • 0.8790/0.8740

Recommendations:

  • Purchases: Have no potential and are highly risky.
  • Sales: Conditions for short-term trades will arise after reversal signals appear near the resistance zone.

EUR/JPY

Analysis:

An upward trend dominates the euro/yen cross chart. The incomplete wave of the short-term trend has been forming since December of last year. A month ago, the final segment of wave (C) began, with the price forming a horizontal pullback in recent days. Its structure is nearing completion.

Forecast:

Next week, the price rise will continue until it is fully completed near the resistance zone. A sideways movement or brief decline to the support zone is more likely in the next couple of days. The highest volatility is expected at the end of the week.

This image is no longer relevant

Potential Reversal Zones

  • Resistance:
    • 175.00/175.50
  • Support:
    • 173.00/172.50

Recommendations:

  • Purchases: Can be used with a fractional lot within individual trading sessions.
  • Sales: Carry a high risk and may become unprofitable once confirmed signals from your trading systems appear.

AUD/JPY

Analysis:

Since December of last year, the direction of price movement in the Australian dollar cross has been set by an upward trend. The price is approaching the lower boundary of the large-scale potential reversal zone. The structure's analysis shows it nearing completion, necessitating the beginning of a correction.

Forecast:

The price is expected to move towards the resistance zone throughout the upcoming week. A breakout beyond the calculated resistance is unlikely. In the second half, a change in direction and a gradual price decline are expected.

This image is no longer relevant

Potential Reversal Zones

  • Resistance:
    • 109.30/109.80
  • Support:
    • 106.30/105.80

Recommendations:

  • Purchases: Can be used intraday with a fractional lot.
  • Sales: Carry a high risk and may become unprofitable once confirmed reversal signals appear near the resistance zone.

US Dollar Index

Analysis:

The incomplete short-term wave of the dollar index is directed north on the chart. A correction (B) has been forming in the last two weeks. The structure of this wave appears complete, but there are no reversal signals on the chart.

Forecast:

At the beginning of the week, a brief decline in dollar quotes to support levels can be expected. Subsequently, the likelihood of a reversal and the resumption of the upward movement increases. The calculated resistance shows the upper boundary of the week's movement.

This image is no longer relevant

Potential Reversal Zones

  • Resistance:
    • 106.00/106.50
  • Support:
    • 104.40/103.90

Recommendations:

The market for major pairs awaits the end of the dollar's decline. Subsequently, conditions for a trend change and the beginning of a weakening of national currencies can be expected.

Explanations: In simplified wave analysis (SWA), all waves consist of 3 parts (A-B-C). The last incomplete wave is analyzed on each timeframe. Expected movements are shown with dashed lines.

Note: The wave algorithm does not account for the duration of movements of instruments over time.

GBPUSD
Great Britain Pound vs US Dollar
Summary
Sell
Urgency
1 week
Analytic
Vyacheslav Ognev
Start trade
Gana con los cambios en el valor de las criptomonedas con InstaForex.
Descarga MetaTrader 4 y abre tu primera operación.
  • Grand Choice
    Contest by
    InstaForex
    InstaForex always strives to help you
    fulfill your biggest dreams.
    UNIRSE AL CONCURSO

Recommended Stories

NG 12 Feb. ¡Los toros mantienen el rumbo hacia un máximo de 4,31!

El marco temporal de cuatro horas muestra el trazado de una onda activa principal (Y), que tiene una forma interna compleja y es un doble zigzag de un nivel

Roman Onegin 07:26 2025-02-12 UTC+2

SP500 12 de febrero. ¡Después de la finalización de la segunda parte del impulso, el precio puede subir más activamente!

Lo más probable es que se esté formando una tendencia alcista mayor en el panorama global del SP500, cuya estructura es similar a la del impulso. Si nos fijamos

Roman Onegin 07:26 2025-02-12 UTC+2

Análisis del par EUR/USD. El 7 de julio. ¿Dónde se encuentra la raíz de todos los problemas del dólar?

El conteo de ondas en el gráfico de 4 horas para el instrumento EUR/USD permanece sin cambios. Actualmente estamos observando la formación de la supuesta onda

Chin Zhao 15:58 2024-07-07 UTC+2

Análisis del par EUR/USD. El 6 de julio. El destino complicado del dólar.

El conteo de ondas en el gráfico de 4 horas para el instrumento EUR/USD permanece sin cambios. Actualmente estamos observando la formación de la supuesta onda

Chin Zhao 15:57 2024-07-07 UTC+2

Análisis del par GBP/USD. El 6 de julio. La libra quiere caer, pero no puede.

La estructura de ondas del instrumento GBP/USD sigue siendo bastante complicada y muy confusa. Alrededor del nivel de 1.2822, que corresponde al 23.6% de Fibonacci y está cerca del pico

Chin Zhao 15:57 2024-07-07 UTC+2

Análisis del par GBP/USD. El 22 de junio. El mercado espera la primera bajada de los tipos de interés en agosto.

El patrón de onda para el instrumento GBP/USD sigue siendo bastante complicado y confuso. Un intento exitoso de romper el nivel de Fibonacci del 50,0% en abril indicó

Chin Zhao 13:12 2024-06-22 UTC+2

Análisis del par EUR/USD. El 22 de junio. La Fed: No está lista para el aterrizaje.

En el gráfico de 4 horas, no hay cambios en la marca de la onda para el instrumento EUR/USD. En este momento, observamos la construcción de la esperada onda

Chin Zhao 10:51 2024-06-22 UTC+2

Análisis del par GBP/USD. El 8 de junio. Los británicos retrocedieron, pero no se rindieron.

El patrón de onda para el instrumento GBP/USD sigue siendo bastante complicado. El intento exitoso de romper el nivel de Fibonacci del 50,0% en abril indicó que el mercado está

Chin Zhao 08:27 2024-06-09 UTC+2

Análisis del par EUR/USD. El 8 de junio. El BCE confía en una mayor desaceleración de la inflación.

El patrón de onda del gráfico de 4 horas para el instrumento EUR/USD se mantiene sin cambios. En este momento, estamos observando la construcción de la onda esperada

Chin Zhao 08:26 2024-06-09 UTC+2

EUR/USD. Análisis del 2 de octubre. Las estadísticas europeas vuelven a decepcionar y el euro vuelve a caer

El análisis de ondas del gráfico de 4 horas para el par euro/dólar sigue siendo bastante claro. Durante el año pasado, solo hemos visto tres estructuras onduladas que se alternan

Chin Zhao 17:48 2023-10-02 UTC+2
¿No puede hablar ahora mismo?
Ingrese su pregunta en el chat.
Widget callback
 

Dear visitor,

Your IP address shows that you are currently located in the USA. If you are a resident of the United States, you are prohibited from using the services of InstaFintech Group including online trading, online transfers, deposit/withdrawal of funds, etc.

If you think you are seeing this message by mistake and your location is not the US, kindly proceed to the website. Otherwise, you must leave the website in order to comply with government restrictions.

Why does your IP address show your location as the USA?

  • - you are using a VPN provided by a hosting company based in the United States;
  • - your IP does not have proper WHOIS records;
  • - an error occurred in the WHOIS geolocation database.

Please confirm whether you are a US resident or not by clicking the relevant button below. If you choose the wrong option, being a US resident, you will not be able to open an account with InstaForex anyway.

We are sorry for any inconvenience caused by this message.