Outlook on July 15:
Analytical overview of popular currency pairs on the H1 chart:
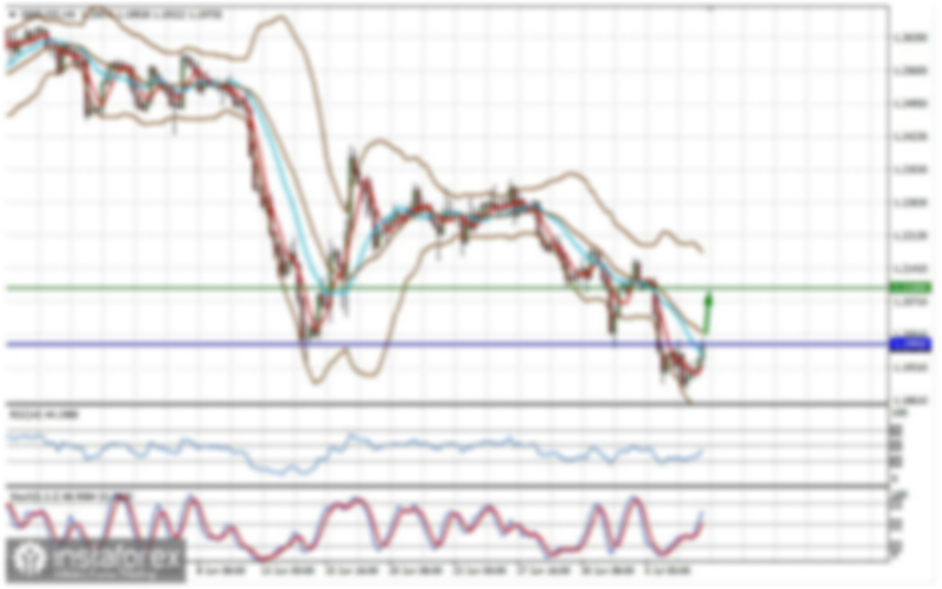
The key levels for the EUR/USD pair are 1.1881, 1.1851, 1.1825, 1.1771, 1.1758, 1.1726, and 1.1710. The local initial downward conditions from July 9 are being monitored. We expect the downward movement to continue after the price breaks through the range of 1.1771 - 1.1758. The target is set at 1.1726. The final potential downward target is 1.1710. After reaching it, the price may consolidate and pull back upwards.
A short-term growth, in turn, is possible in the 1.1825 - 1.1851 range. If the latter is broken, it will encourage the formation of a strong structure for the development of an upward trend. The potential target is 1.1881.
The main trend is the local downward trend from July 9.
Trading recommendations:
Buy: 1.1827 Take profit: 1.1850
Buy: 1.1853 Take profit: 1.1880
Sell: 1.1758 Take profit: 1.1727
Sell: 1.1725 Take profit: 1.1710
The key levels for the GBP/USD pair are 1.4051, 1.4009, 1.3968, 1.3919, 1.3884, 1.3800, 1.3781, and 1.3740. The price has been moving in a bullish trend since July 8, but it is expected to cancel this pattern, which requires breaking through the range of 1.3800 - 1.3781. The first potential target is set at 1.3740. We expect growth to resume after the price breaks through the level of 1.3884. The breakdown of the first target is 1.3919 should be accompanied by a strong growth towards the next target of 1.3968. The price may consolidate around this level. In the meantime, the ultimate potential upward target is 1.4009. The price may consolidate and pull back downwards after reaching this level.
The main trend is the upward trend from July 8, deep correction stage.
Trading recommendations:
Buy: 1.3884 Take profit: 1.3917
Buy: 1.3921 Take profit: 1.3968
Sell: 1.3780 Take profit: 1.3742
Sell: Take profit:
The key levels for the USD/CHF pair are 0.9234, 0.9200, 0.9182, 0.9131, 0.9100, 0.9050 and 0.9031. The price has formed a strong downward trend from July 7. We expect this trend to resume after the level of 0.9131 is broken. The target is set at 0.9100 and the price may consolidate around it. If the specified target is broken, a strong decline will continue to the target of 0.9050. The final potential downward target is 0.9031. After reaching it, the price may consolidate and pull back upwards.
The price is likely in the range of 0.9182 - 0.9200. If the level of 0.9200 is broken, a deep correction will occur. The target is set at 0.9234, which is the key support level.
The main trend is the downward trend from July 7.
Trading recommendations:
Buy: 0.9203 Take profit: 0.9234
Buy: 0.9236 Take profit: 0.9265
Sell: 0.9130 Take profit: 0.9103
Sell: 0.9098 Take profit: 0.9050
The key levels for the USD/JPY pair are 110.71, 110.38, 110.17, 110.06, 109.84, 109.66, 109.33, and 109.20. The price is forming a local downward potential for July 14. Now, we expect a short-term decline in the 109.84 - 109.66 range. If the latter is broken, it should be accompanied by a strong decline towards the target of 109.33. The ultimate potential downward target is 109.20. After reaching it, the price may consolidate and pull back upwards.
The price breaking through the range of 110.06 - 110.17 will lead to a deep movement. The target is set at 110.38, which is also the key support level. Its breakdown will encourage the formation of an upward trend. The first potential target is set at 110.71.
The main trend is the formation of a local downward trend from July 14.
Trading recommendations:
Buy: 110.17 Take profit: 110.37
Buy: 110.40 Take profit: 110.70
Sell: 109.83 Take profit: 109.67
Sell: 109.64 Take profit: 109.34
The key levels for the USD/CAD pair are 1.2695, 1.2636, 1.2609, 1.2538, 1.2450, 1.2400, and 1.2303. The price has been moving in an upward trend since July 6. We expect this trend to continue after the level of 1.2538 is broken. The target is set at 1.2609. After that, short-term growth and consolidation are possible in the 1.2609 - 1.2636 range. The final potential upward target is 1.2695. After reaching it, a downward pullback can be expected.
On the other hand, a short-term decline is possible in the range of 1.2450 - 1.2400, hence an upward reversal is very possible. If the last value is broken, it will favor the development of a downward trend. The target is set at 1.2303.
The main trend is the upward trend from July 6.
Trading recommendations:
Buy: 1.2540 Take profit: 1.2609
Buy: 1.2637 Take profit: 1.2695
Sell: 1.2449 Take profit: 1.2403
Sell: 1.2495 Take profit: 1.2310
The key levels for the AUD/USD pair are 0.7538, 0.7497, 0.7440, 0.7409, 0.7390, 0.7354, 0.7319 and 0.7291. The situation is in equilibrium: the downward trend from July 6 and the upward potential from July 9. We expect the price to continue to decline after the level of 0.7440 is broken. The first target is set at 0.7409. After that, a short-term downward trend is expected in the 0.7409 - 0.7390 range. If the latter is broken, strong movement will continue to target 0.7354. The price may consolidate around it. The breakdown of the indicated target will allow us to move to the level of 0.7319. The ultimate potential upward target is set at 0.7291. After reaching it, an upward pullback can be expected.
Meanwhile, the key support for the downside is the level of 0.7497. Its breakdown will encourage the development of an upward trend. The first potential target is 0.7538.
The main trend is the downward trend from July 6, correction stage.
Trading recommendations:
Buy: 0.7500 Take profit: 0.7530
Buy: Take profit:
Sell: 0.7440 Take profit: 0.7410
Sell: 0.7388 Take profit: 0.7356
The key levels for the EUR/JPY pair are 131.06, 130.58, 130.33, 129.87, 129.71, 129.22, and 129.05. The price has been moving in a local downward trend since July 13. We expect the downward movement to continue after the price breaks through the 129.87 - 129.71 range. The target is set at 129.22. The final potential downward target is 129.05. After reaching it, the price may consolidate and pull back upwards.
In turn, short-term growth is likely in the 130.33 - 130.58 range. If the level of 130.58 is broken, the upward trend will develop. The first target is set at 131.06.
The main trend is the local downward trend from July 13.
Trading recommendations:
Buy: 130.33 Take profit: 130.55
Buy: 130.60 Take profit: 131.06
Sell: 129.70 Take profit: 129.25
Sell: 129.22 Take profit: 129.05
The key levels for the GBP/JPY pair are 154.73, 154.40, 153.58, 153.28, 152.77, 152.45, 151.70, 151.21 and 150.66. The price has been moving in an upward trend since July 8, but it is currently in the correction stage and is close to canceling this trend, which requires a breakdown of 151.70. In any case, we expect a short-term growth in the 152.45 - 152.77 range. If the latter is broken, the price can move to the level of 153.28. After that., another short-term growth and consolidation are possible in the range of 153.28 - 153.58. The main development of the upward trend is expected after breaking through the level of 153.58. The potential target is 154.73.
The downward trend is likely to develop after the level of 151.70 is broken. The first target is set at 151.21. The price may consolidate around it. The final potential downward target is set at 150.66. After reaching it, an upward pullback can be expected.
The main trend is the upward trend from July 8.
Trading recommendations:
Buy: 152.45 Take profit: 152.75
Buy: 152.80 Take profit: 153.28
Sell: 151.70 Take profit: 151.24
Sell: 151.19 Take profit: 150.66