

signal strength 2 of 5
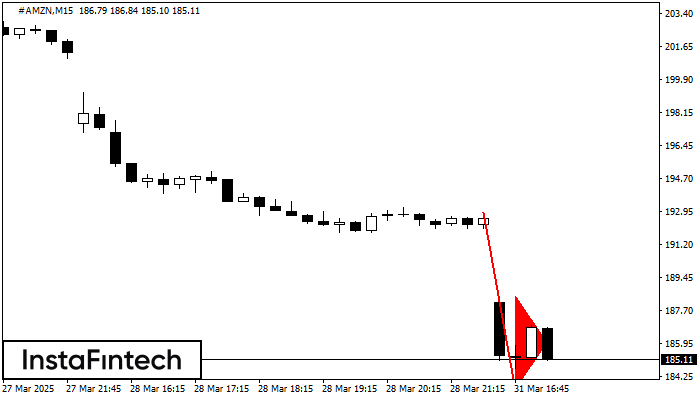
The Bearish pennant pattern has formed on the #AMZN M15 chart. The pattern signals continuation of the downtrend in case the pennant’s low of 183.52 is broken through. Recommendations: Place the sell stop pending order 10 pips below the pattern’s low. Place the take profit order at the projection distance of the flagpole height.
The M5 and M15 time frames may have more false entry points.
- All
- Double Top
- Flag
- Head and Shoulders
- Pennant
- Rectangle
- Triangle
- Triple top
- All
- #AAPL
- #AMZN
- #Bitcoin
- #EBAY
- #FB
- #GOOG
- #INTC
- #KO
- #MA
- #MCD
- #MSFT
- #NTDOY
- #PEP
- #TSLA
- #TWTR
- AUDCAD
- AUDCHF
- AUDJPY
- AUDUSD
- EURCAD
- EURCHF
- EURGBP
- EURJPY
- EURNZD
- EURRUB
- EURUSD
- GBPAUD
- GBPCHF
- GBPJPY
- GBPUSD
- GOLD
- NZDCAD
- NZDCHF
- NZDJPY
- NZDUSD
- SILVER
- USDCAD
- USDCHF
- USDJPY
- USDRUB
- All
- M5
- M15
- M30
- H1
- D1
- All
- Buy
- Sale
- All
- 1
- 2
- 3
- 4
- 5
was formed on 25.04 at 10:14:51 (UTC+0)
signal strength 1 of 5
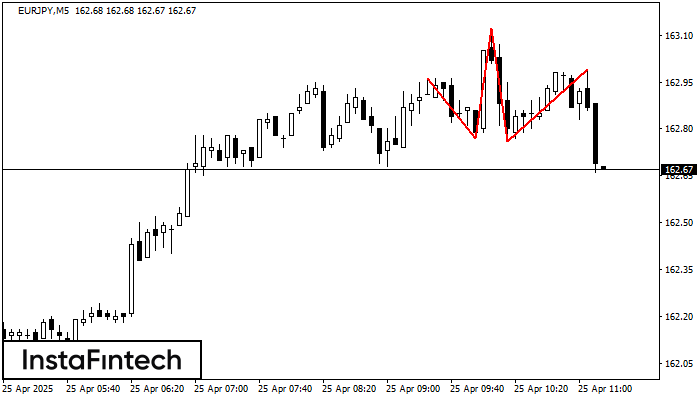
EURJPY M5 ได้สร้างรูปแบบ รูปแบบกราฟหัวและหัวไหล่ (Head and Shoulders) พร้อมกับคุณลักษณะดังต่อไปนี้ : ระดับสูงของตำแหน่งหัวอยู่ที่ 163.12, ตำแหน่งคอ และมุมขาขึ้นอยู่ที่ 162.77/162.76 การก่อตัวของรูปแบบเช่นนี้
ขอบเตระยะเวลาใน M5 และ M15 อาจจะมีตำแหน่งการเข้าใช้งานที่ผิดพลาดมากยิ่งขึ้น
Open chart in a new windowwas formed on 25.04 at 10:00:07 (UTC+0)
signal strength 1 of 5
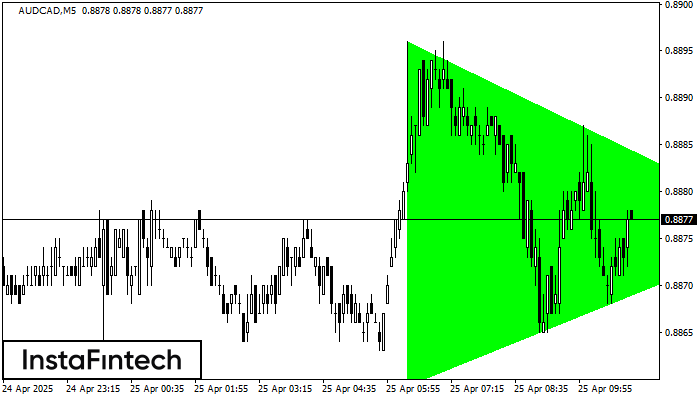
อ้างอิงจากชาร์ตของ M5, AUDCAD ที่ได้สร้างรูปแบบ รูปแบบสามเหลี่ยมสมมาตรขาขึ้น (Bullish Symmetrical Triangle) ออกมา ซึ่งแสดงให้เห็นว่า แนวโน้มยังคงเดินหน้าต่อไป คำอธิบาย ขอบเขตด้านบนของรูปแบบนี้สัมผัสพิกัด 0.8896/0.8876 แม้ว่าขอบเขตด้านล่างก้าวผ่าน
ขอบเตระยะเวลาใน M5 และ M15 อาจจะมีตำแหน่งการเข้าใช้งานที่ผิดพลาดมากยิ่งขึ้น
Open chart in a new window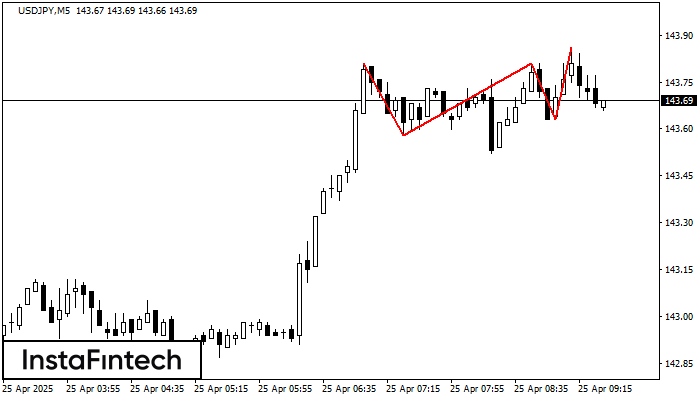
ในชาร์ตของตราสารการซื้อขาย USDJPY M5 กราฟรูปแบบ รูปแบบกราฟจุดสามยอด (Triple Top) ที่แสดงให้เห็นถึง การเปลี่ยนแปลงของแนวโน้มที่ถูกสร้างขึ้นมา มันเป็นไปได้ที่ หลังจากการก่อตัวของระดับสูงสุดอันดับสามมาแล้ว ราคาจะพยายามเคลื่อนตัวทะลุผ่านระดับของแนวต้าน 143.58 ที่พวกเราแนะนำให้เปิดสถานะการเทรดไว้เพื่อเป็นการขาย ตำแหน่งการทำกำไรเป็นระยะทางของความกว้างในกราฟรูปแบบนี้
ขอบเตระยะเวลาใน M5 และ M15 อาจจะมีตำแหน่งการเข้าใช้งานที่ผิดพลาดมากยิ่งขึ้น
Open chart in a new window


